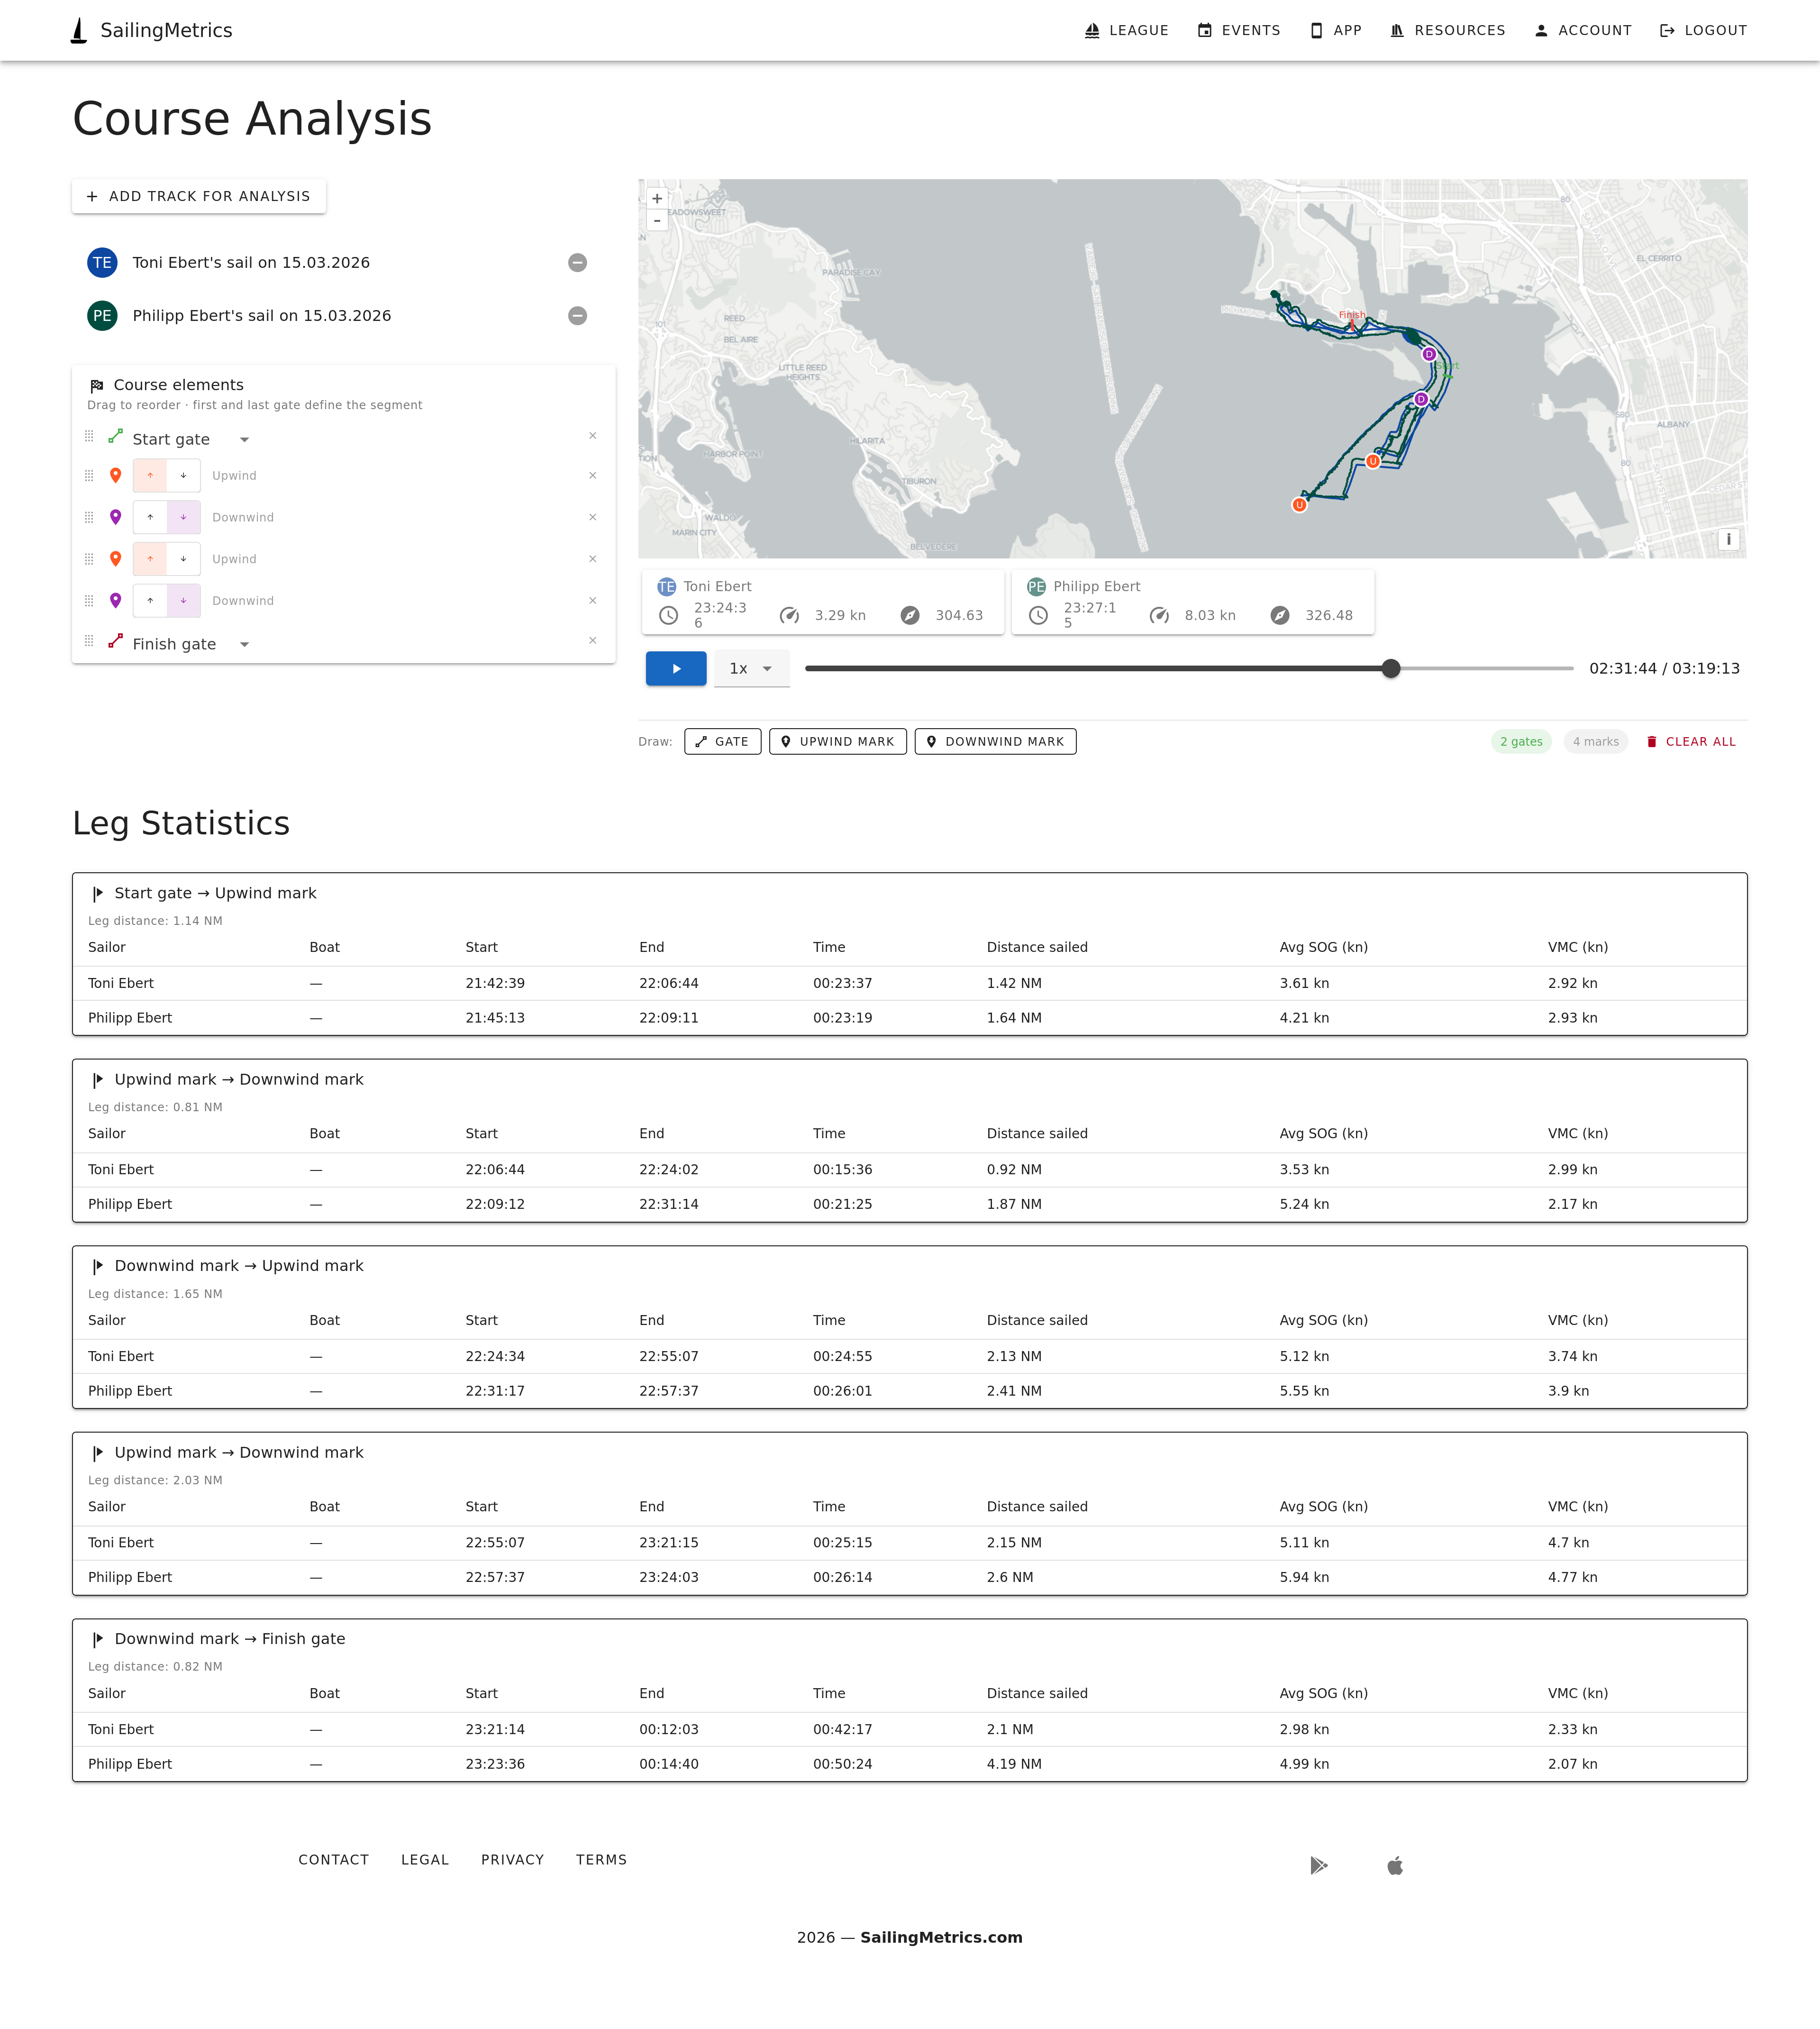
Course Analysis
The Course Analysis page lets you load GPS tracks from multiple sailors onto the same map, define the course they sailed using gates and marks, and automatically break each track into legs. For every leg the system calculates duration, distance sailed, average speed over ground, and VMC so you can compare each sailor's performance on the same stretch of water side by side.
The tool is accessible from the Sails section of the main navigation. You need at least one recorded GPS activity in your account to use it. All processing happens automatically as you add tracks and define course elements — there is no separate "run analysis" step.
Step 1: Add tracks
Click the "Add track for analysis" button in the left panel to open the activity selector. The dialog shows a paginated list of your GPS activities, each with the date, sailor name, and boat. Click the plus icon on any row to add that activity to the comparison. You can add as many tracks as you like.
Each added activity appears in the list below the button. It is assigned a colour automatically so that its track on the map and its row in the metrics panel can be identified at a glance. To remove an activity from the comparison, click the minus icon next to it in the list.
Tracks do not need to come from the same race or event. You can mix sessions from different dates as long as they were sailed on the same or a comparable course, and the gate-based segmentation will still produce comparable leg statistics.
Step 2: Define the course
Below the map there is a drawing toolbar with three tools. You need to define at least two gates before leg statistics can be generated.
- Gate — draws a line across the track. Click to place vertices on the map, then double-click to finish the line. The gate line must physically cross the GPS tracks at the point where the boats sailed through it. The first gate you draw defaults to a start gate type. Subsequent gates default to a generic gate. You can change any gate's type using the dropdown in the course elements list.
- Upwind mark — places a single point on the map representing a mark the boats round at the top of the course. Click once on the map to place it. These are labelled "Upwind mark" in the leg statistics.
- Downwind mark — places a point representing a mark at the bottom of the course. Click once to place it. These are labelled "Downwind mark" in the leg statistics.
Once drawn, all course elements appear in the course elements list in the left panel. Each entry shows a colour-coded icon, the type label, and a delete button. For gates you can select the type (Start gate, Finish gate, or Gate) from a dropdown. For marks you can toggle between Upwind and Downwind using the arrow buttons.
Step 3: Set the element order
The order of the course elements in the list defines the sequence of legs. The leg from element one to element two becomes Leg 1, the leg from element two to element three becomes Leg 2, and so on. Each leg is labelled using the type names of the two bounding elements, so a leg from a Start gate to an Upwind mark appears as "Start gate to Upwind mark" in the statistics table.
To reorder the elements, drag and drop them within the list. A drag handle appears on the left of each row. While dragging, a blue indicator line shows where the element will be placed when you release. The statistics update automatically after every reorder.
A typical windward-leeward course would be ordered as: Start gate, Upwind mark, Downwind mark (or Finish gate if the finish is at the bottom). A course with a reaching leg might be: Start gate, Upwind mark, Gate (reaching mark), Downwind mark, Finish gate.
Automatic inference from GPS track
When you add a GPS track, the system automatically analyses the recorded path and infers the course elements from it. Marks, gates, and the overall course structure are detected from the GPS data without any manual drawing required. The inferred elements appear immediately in the course elements list, ready for use in leg statistics.
You can edit inferred elements in the same way as manually drawn ones. Delete an element and redraw it if the inferred position does not match where the mark actually was, or drag elements to reorder them if the detected sequence needs adjusting.
Auto-population from race data
If the first activity you add was recorded as part of a structured race in SailingMetrics and the race has a course defined, the course elements are populated automatically. The start gate, finish gate, and all intermediate marks appear in the list without any drawing required. The positions come from the stored course definition, so they reflect where the actual marks were set.
You can edit auto-populated elements in the same way as manually drawn ones. Delete an element and redraw it if the stored position does not match where the mark actually was, or drag elements to reorder them if the sequence needs adjusting.
Step 4: Use the map replay
The map shows all loaded tracks simultaneously, each in its assigned colour, along with the drawn course elements. Use the playback controls below the map to review the session:
- Play / Pause — starts or stops the replay. Boat icons move along their respective tracks and rotate to show each boat's heading at the current moment.
- Speed — select 1x, 2x, 4x, or 8x playback speed. At 8x a forty-minute race takes about five minutes to replay.
- Slider — drag to jump to any point in the session. The duration counter on the right shows the current position and the total duration of the longest track.
A metrics panel below the playback controls shows a card for each loaded activity. Each card displays the sailor's name and boat, and updates in real time with the current timestamp, speed over ground in knots, and compass heading for that sailor at the current slider position.
Step 5: Read the leg statistics
Once at least two gates are defined and at least one activity is loaded, a Leg Statistics section appears below the map. There is one table per leg, labelled with the names of the bounding elements and a subtitle showing the straight-line leg distance between the two gates.
Each row in a leg table represents one sailor's performance on that leg. The columns are:
- Sailor — the name of the account that recorded the activity.
- Boat — the boat name associated with the activity, if one is set.
- Start — the time of day when that sailor crossed the opening gate of the leg.
- End — the time of day when that sailor crossed the closing gate of the leg.
- Time — the duration of the leg for that sailor, from their individual gate crossing to the next. This is the fairest single number for comparing performance because it accounts for each sailor's own start time rather than measuring from a common gun.
- Distance sailed — the total GPS track distance covered during the leg, in nautical miles. Comparing this against the leg distance subtitle shows how direct or indirect each sailor's path was.
- Avg SOG (kn) — the average speed over ground during the leg, in knots. Most directly comparable on legs where all boats are sailing similar angles.
- VMC (kn) — the average Velocity Made on Course during the leg, in knots. This is the component of the boat's velocity toward the next gate, averaged over the full leg. On upwind and downwind legs this is a more meaningful comparison than raw speed because it accounts for differences in sailing angle.
If a sailor's track does not cross a gate — because they retired, because the track ended early, or because the drawn gate line does not intersect their GPS path — that leg simply does not appear for them. Check that the gate line crosses the track visually on the map if you expect a crossing that is not being detected.
Tips for accurate segmentation
- Draw gate lines so they extend clearly across all the tracks you are comparing, not just one. A gate line that crosses some tracks but not others will only produce statistics for the sailors it intersects.
- Position gate lines at the actual crossing points on the water rather than at the buoy location. Start and finish lines in particular should be drawn where the boats actually crossed, which is often a short distance from the committee boat or pin end mark.
- If the statistics show no data for a leg despite tracks being loaded and gates being defined, check that the gate line visually crosses the track on the map. Zoom in to confirm the intersection.
- Reordering the course elements changes the leg assignments immediately. If the statistics look unexpected, verify that the element order in the list matches the order the boats sailed the course.